[ Web Proxy ]
URL:
Viewing: https://matplotlib.org/devdocs/api/_as_gen/../_as_gen/matplotlib.axes.Axes.tick_params.html [Back]  [Original]

matplotlib.axes.Axes.tick_params — Matplotlib 3.12.0.dev843+g39b27ddaa documentation
Back to top
Search the docs ...:

matplotlib.axes.Axes.tick_params#

Axes.tick_params(axis='both', **kwargs)[source]#

Change the appearance of ticks, tick labels, and gridlines.

Tick properties that are not explicitly set using the keyword arguments remain unchanged unless reset is True. For the current style settings, see Axis.get_tick_params.

Parameters:
axis{'x', 'y', 'both'}, default: 'both'

The axis to which the parameters are applied.

which{'major', 'minor', 'both'}, default: 'major'

The group of ticks to which the parameters are applied.

resetbool, default: False

Whether to reset the ticks to defaults before updating them.

Other Parameters:
direction{'in', 'out', 'inout'}

Puts ticks inside the Axes, outside the Axes, or both.

lengthfloat

Tick length in points.

widthfloat

Tick width in points.

colorcolor

Tick color.

padfloat

Distance in points between tick and label.

labelsizefloat or str

Tick label font size in points or as a string (e.g., 'large').

labelcolorcolor

Tick label color.

labelfontfamilystr

Tick label font.

colorscolor

Tick color and label color.

zorderfloat

Tick and label zorder.

bottom, top, left, rightbool

Whether to draw the respective ticks.

labelbottom, labeltop, labelleft, labelrightbool

Whether to draw the respective tick labels.

labelrotationfloat

Tick label rotation angle in degrees. See Text.set_rotation.

labelrotation_mode{'default', 'anchor', 'xtick', 'ytick'}

Tick label rotation mode. See Text.set_rotation_mode.

grid_colorcolor

Gridline color.

grid_alphafloat

Transparency of gridlines: 0 (transparent) to 1 (opaque).

grid_linewidthfloat

Width of gridlines in points.

grid_linestylelinestyle

Linestyle of the gridlines.

Examples

ax.tick_params(direction='out', length=6, width=2, colors='r',
               grid_color='r', grid_alpha=0.5)

This will make all major ticks be red, pointing out of the box, and with dimensions 6 points by 2 points. Tick labels will also be red. Gridlines will be red and translucent.

Examples using matplotlib.axes.Axes.tick_params#

[]

Pareto chart

Pareto chart
[]

Scatter plot with histograms

Scatter plot with histograms
[]

Image with masked values

Image with masked values
[]

Annotated heatmap

Annotated heatmap
[]

Polar legend

Polar legend
[]

Plots with different scales

Plots with different scales
[]

Multiple y-axis with Spines

Multiple y-axis with Spines
[]

Axes properties

Axes properties
[]

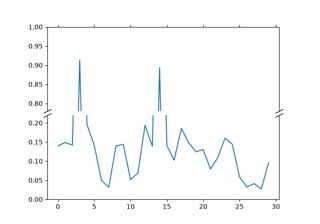
Broken axis

Broken axis
[]

Major and minor ticks

Major and minor ticks
[]

Left-aligned y tick labels

Left-aligned y tick labels
[]

Move x/y-axis ticks and labels on top and right

Move x/y-axis ticks and labels on top and right
[]

Center labels between ticks

Center labels between ticks
[]

Rotated tick labels

Rotated tick labels
[]

Date tick locators and formatters

Date tick locators and formatters
[]

Format date ticks using ConciseDateFormatter

Format date ticks using ConciseDateFormatter
[]

Customizing figure and axes appearance

Customizing figure and axes appearance
[]

Color Demo

Color Demo
[]

Named color sequences

Named color sequences
[]

Histogram as colorbar

Histogram as colorbar
[]

Demo Axes Grid

Demo Axes Grid
[]

Inset locator demo

Inset locator demo
[]

Inset locator demo 2

Inset locator demo 2
[]

Make room for ylabel using axes_grid

Make room for ylabel using axes_grid
[]

Simple axes divider 3

Simple axes divider 3
[]

Evans test

Evans test
[]

Anatomy of a figure

Anatomy of a figure
[]

Stock prices over 32 years

Stock prices over 32 years
[]

Anscombe's quartet

Anscombe's quartet
[]

Axis ticks

Axis ticks
[]

Text in Matplotlib

Text in Matplotlib

Web Proxy Viewer  |  New URL  |  Original Page