[ Web Proxy ]
URL:
Viewing: https://matplotlib.org/users/../api/_as_gen/matplotlib.axes.Axes.set_ylabel.html [Back]  [Original]

matplotlib.axes.Axes.set_ylabel — Matplotlib 3.11.2 documentation
Back to top
Search the docs ...:

matplotlib.axes.Axes.set_ylabel#

Axes.set_ylabel(ylabel, fontdict=None, labelpad=None, *, loc=None, **kwargs)[source]#

Set the label for the y-axis.

Parameters:
ylabelstr

The label text.

labelpadfloat, default: rcParams["axes.labelpad"] (default: 4.0)

Spacing in points from the Axes bounding box including ticks and tick labels. If None, the previous value is left as is.

loc{'bottom', 'center', 'top'}, default: rcParams["yaxis.labellocation"] (default: 'center')

The label position. This is a high-level alternative for passing parameters y and horizontalalignment.

Other Parameters:
**kwargsText properties

Text properties control the appearance of the label.

See also

text

Documents the properties supported by Text.

Examples using matplotlib.axes.Axes.set_ylabel#

[]

Grouped bar chart with labels

Grouped bar chart with labels
[]

Bar chart with individual bar colors

Bar chart with individual bar colors
[]

Hat graph

Hat graph
[]

Scatter Demo2

Scatter Demo2
[]

Mapping marker properties to multivariate data

Mapping marker properties to multivariate data
[]

fill_between with transparency

fill_between with transparency
[]

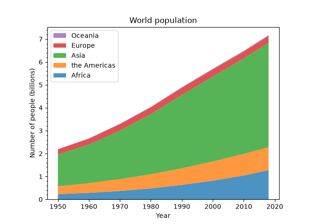
Stackplots and streamgraphs

Stackplots and streamgraphs
[]

Triplot Demo

Triplot Demo
[]

Tripcolor Demo

Tripcolor Demo
[]

Tricontour Demo

Tricontour Demo
[]

Contourf demo

Contourf demo
[]

Annotated heatmap

Annotated heatmap
[]

Spectrogram

Spectrogram
[]

Histogram bins, density, and weight

Histogram bins, density, and weight
[]

Multiple histograms side by side

Multiple histograms side by side
[]

Cumulative distributions

Cumulative distributions
[]

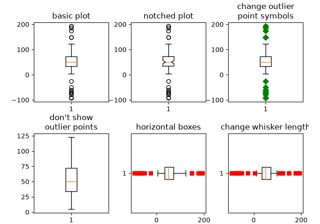
Boxplots

Boxplots
[]

Box plots with custom fill colors

Box plots with custom fill colors
[]

Box plot vs. violin plot comparison

Box plot vs. violin plot comparison
[]

Violin plot customization

Violin plot customization
[]

Power spectral density (PSD)

Power spectral density (PSD)
[]

Cross spectral density (CSD)

Cross spectral density (CSD)
[]

Multiple subplots

Multiple subplots
[]

Axes Demo

Axes Demo
[]

Resize Axes with constrained layout

Resize Axes with constrained layout
[]

Resize Axes with tight layout

Resize Axes with tight layout
[]

Figure subfigures

Figure subfigures
[]

Shared axis

Shared axis
[]

Plots with different scales

Plots with different scales
[]

Twin Axes with delta_zorder

Twin Axes with delta_zorder
[]

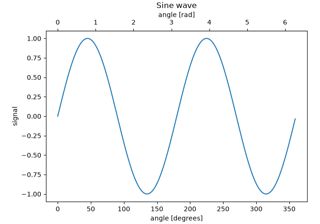
Secondary Axis

Secondary Axis
[]

Align labels and titles

Align labels and titles
[]

Axis label position

Axis label position
[]

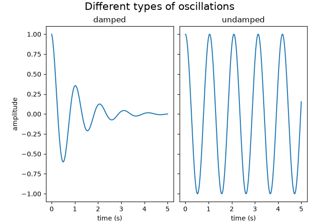
Figure labels: suptitle, supxlabel, supylabel

Figure labels: suptitle, supxlabel, supylabel
[]

Move x/y-axis ticks and labels on top and right

Move x/y-axis ticks and labels on top and right
[]

Rotated tick labels

Rotated tick labels
[]

Date tick labels

Date tick labels
[]

Asinh scale

Asinh scale
[]

Symlog scale

Symlog scale
[]

Text properties

Text properties
[]

Multiline text

Multiline text
[]

Legend Demo

Legend Demo
[]

Accented text

Accented text
[]

Mathtext

Mathtext
[]

Render math equations using TeX

Render math equations using TeX
[]

Line, Poly and RegularPoly Collection

Line, Poly and RegularPoly Collection
[]

Ellipse Collection

Ellipse Collection
[]

Color Demo

Color Demo
[]

Dark background style sheet

Dark background style sheet
[]

Plot 2D data on 3D plot

Plot 2D data on 3D plot
[]

Create 2D bar graphs in different planes

Create 2D bar graphs in different planes
[]

3D errorbars

3D errorbars
[]

Lorenz attractor

Lorenz attractor
[]

2D and 3D Axes in same figure

2D and 3D Axes in same figure
[]

Automatic text offsetting

Automatic text offsetting
[]

Scales on 3D (Log, Symlog, etc.)

Scales on 3D (Log, Symlog, etc.)
[]

3D scatterplot

3D scatterplot
[]

3D surface with polar coordinates

3D surface with polar coordinates
[]

Text annotations in 3D

Text annotations in 3D
[]

Make room for ylabel using axes_grid

Make room for ylabel using axes_grid
[]

Parasite Simple

Parasite Simple
[]

Ticklabel alignment

Ticklabel alignment
[]

Simple axis tick label and tick directions

Simple axis tick label and tick directions
[]

Simple Axisline

Simple Axisline
[]

Pick event demo

Pick event demo
[]

Anatomy of a figure

Anatomy of a figure
[]

XKCD

XKCD
[]

Topographic hillshading

Topographic hillshading
[]

Artist tutorial

Artist tutorial
[]

Coding shortcuts

Coding shortcuts
[]

Quick start guide

Quick start guide
[]

Arranging multiple Axes in a Figure

Arranging multiple Axes in a Figure
[]

Axis scales

Axis scales
[]

Constrained layout guide

Constrained layout guide
[]

Tight layout guide

Tight layout guide
[]

Choosing Colormaps in Matplotlib

Choosing Colormaps in Matplotlib
[]

Text in Matplotlib

Text in Matplotlib

Web Proxy Viewer  |  New URL  |  Original Page