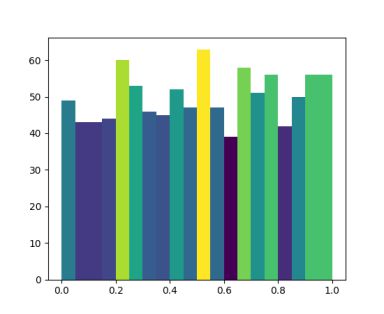
pylab_examples example code: hist_colormapped.py
(Source code, png, pdf)
import numpy as np
import matplotlib.pyplot as plt
import matplotlib.cm as cm
import matplotlib.colors as colors

fig, ax = plt.subplots()
Ntotal = 1000
N, bins, patches = ax.hist(np.random.rand(Ntotal), 20)

# I'll color code by height, but you could use any scalar


# we need to normalize the data to 0..1 for the full
# range of the colormap
fracs = N.astype(float)/N.max()
norm = colors.Normalize(fracs.min(), fracs.max())

for thisfrac, thispatch in zip(fracs, patches):
    color = cm.viridis(norm(thisfrac))
    thispatch.set_facecolor(color)


plt.show()
Keywords: python, matplotlib, pylab, example, codex (see Search examples)
 [matplotlib]
 [forkme_right_orange_ff7600.png]