


Languages
Topics Overview JavaScript JSON HTML Emmet CSS, SCSS and Less TypeScript Markdown PowerShell C++ Java PHP Python Julia R Ruby Rust Go T-SQL C# .NET Swift Working with JavaScript Node.js Tutorial Node.js Debugging Deploy Node.js Apps Browser Debugging Angular Tutorial React Tutorial Vue Tutorial Debugging Recipes Performance Profiling Extensions Tutorial Transpiling Editing Refactoring Debugging Quick Start Tutorial Run Python Code Editing Linting Formatting Debugging Environments Testing Python Interactive Django Tutorial FastAPI Tutorial Flask Tutorial Create Containers Deploy Python Apps Python in the Web Settings Reference Getting Started Navigate and Edit Refactoring Formatting and Linting Project Management Build Tools Run and Debug Testing Spring Boot Modernizing Java Apps Application Servers Deploy Java Apps GUI Applications Extensions FAQ Intro Videos GCC on Linux GCC on Windows GCC on Windows Subsystem for Linux Clang on macOS Microsoft C++ on Windows Build with CMake CMake Tools on Linux CMake Quick Start C++ Dev Tools for Copilot Editing and Navigating Debugging Configure Debugging Refactoring Settings Reference Configure IntelliSense Configure IntelliSense for Cross-Compiling FAQ Intro Videos Get Started Navigate and Edit IntelliCode Refactoring Formatting and Linting Project Management Build Tools Package Management Run and Debug Testing FAQOn this page there are 4 sections
Debugging TypeScript
Visual Studio Code supports TypeScript debugging through its built-in Node.js debugger and Edge and Chrome debugger.
JavaScript source map support
TypeScript debugging supports JavaScript source maps. To generate source maps for your TypeScript files, compile with the --sourcemap option or set the sourceMap property in the tsconfig.json file to true.
In-lined source maps (a source map where the content is stored as a data URL instead of a separate file) are also supported, although in-lined source is not yet supported.
For a simple example of source maps in action, see the TypeScript tutorial, which shows debugging a simple "Hello World" Node.js application using the following tsconfig.json and VS Code default Node.js debugging configuration.
{
  // Use IntelliSense to learn about possible attributes.
  // Hover to view descriptions of existing attributes.
  // For more information, visit: https://go.microsoft.com/fwlink/?linkid=830387
  "version": "0.2.0",
  "configurations": [
    {
      "type": "node",
      "request": "launch",
      "name": "Launch Program",
      "program": "${workspaceFolder}/helloworld.ts",
      "preLaunchTask": "tsc: build - tsconfig.json",
      "outFiles": ["${workspaceFolder}/out/**/*.js"]
    }
  ]
}
VS Code has determined the program to launch, helloworld.ts, included the build as a preLaunchTask, and told the debugger where to find the generated JavaScript files.
There is full IntelliSense with suggestions and information for launch.json to help you learn about other debug configuration options. You can also add new debug configurations to launch.json with the Add Configuration button in the lower right.

Also see Node.js Debugging for examples and further explanations.
Mapping the output location
If generated (transpiled) JavaScript files do not live next to their source, you can help the VS Code debugger locate them by setting the outFiles attribute in the launch configuration. Whenever you set a breakpoint in the original source, VS Code tries to find the generated source by searching the files specified by glob patterns in outFiles.
Client-side debugging
TypeScript is great for writing client-side code as well as Node.js applications and you can debug client-side source code with the built-in Edge and Chrome debugger.
We'll create a tiny web application to show client-side debugging in action.
Create a new folder HelloWeb and add three files: helloweb.ts, helloweb.html, and tsconfig.json with the following content:
helloweb.ts
<!DOCTYPE html>
<html>
    <head><title>TypeScript Hello Web</title></head>
    <body>
        <script src="out/helloweb.js"></script>
    </body>
</html>
tsconfig.json
{
  "version": "0.2.0",
  "configurations": [
    {
      "type": "msedge",
      "request": "launch",
      "name": "Launch Edge against localhost",
      "url": "file:///C:/Users/username/HelloWeb/helloweb.html",
      "webRoot": "${workspaceFolder}"
    }
  ]
}
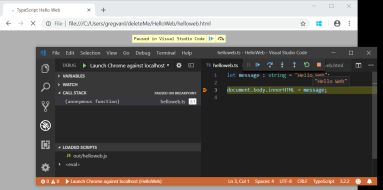
The Run and Debug view configuration dropdown will now show the new configuration Launch Edge against localhost. If you run that configuration, your browser will launch with your web page. Open helloweb.ts in the editor and click the left gutter to add a breakpoint (it will be displayed as a red circle). Press F5 to start the debug session, which launches the browser and hits your breakpoint in helloweb.ts.
 [client-side debug breakpoint]
Common questions
Cannot launch program because corresponding JavaScript cannot be found
You've likely not set "sourceMap": true in your tsconfig.json or outFiles in your launch.json and the VS Code Node.js debugger can't map your TypeScript source code to the running JavaScript. Turn on source maps and rebuild your project.


![[]](https://code.visualstudio.com/assets/icons/search-dark.svg)
![[]](https://code.visualstudio.com/assets/icons/search.svg)
![[Switch to the dark theme]](https://code.visualstudio.com/assets/icons/theme-light.svg)
![[Switch to the light theme]](https://code.visualstudio.com/assets/icons/theme-dark.svg)
![[launch.json IntelliSense]](https://code.visualstudio.com/assets/docs/typescript/debugging/launch-json-intellisense.png)
![[client-side debug breakpoint]](https://code.visualstudio.com/assets/docs/typescript/debugging/client-side-debug-breakpoint.png)
![[VS Code on Github]](https://code.visualstudio.com/assets/icons/github-icon.svg)
![[Follow us on X]](https://code.visualstudio.com/assets/icons/x-icon.svg)
![[VS Code on LinkedIn]](https://code.visualstudio.com/assets/icons/linkedin-icon.svg)
![[VS Code on Bluesky]](https://code.visualstudio.com/assets/icons/bluesky-icon.svg)
![[Join the VS Code community on Reddit]](https://code.visualstudio.com/assets/icons/reddit-icon.svg)
![[The VS Code Insiders Podcast]](https://code.visualstudio.com/assets/icons/podcast-icon.svg)
![[VS Code on TikTok]](https://code.visualstudio.com/assets/icons/tiktok-icon.svg)
![[VS Code on YouTube]](https://code.visualstudio.com/assets/icons/youtube-icon.svg)
![[Microsoft homepage]](https://code.visualstudio.com/assets/icons/microsoft.svg)